
01
Plant comparisons
Side-by-side plant comparisons help leaders spot differences and investigate risk.
Compare plant and shift information and explore operational patterns with AI-assisted summaries.
Designed for Operations leaders and reporting teams

01 / A familiar problem
Leadership needs to compare the latest shift across three plants.
02 / See the workflow
Follow the three stages to see how analytics connects information with action.
How do our plants compare this shift?
Bring plant and shift KPIs into a consistent reporting view.
03 / Inside Analytics
Give your team the visibility and context to move the workflow forward.
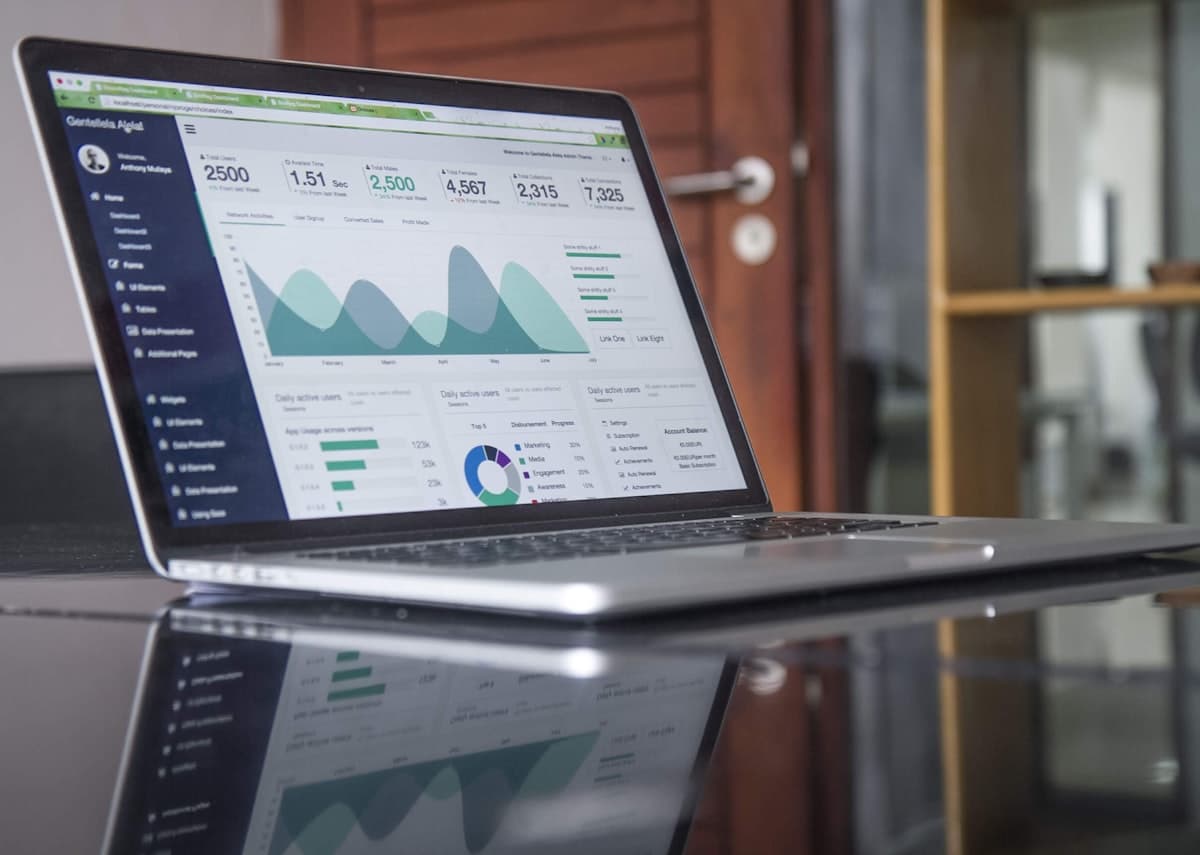
Side-by-side plant comparisons help leaders spot differences and investigate risk.
Shift trends connect today's exceptions with a longer operational picture.
Executive summaries bring the same figures into plant and leadership reviews.
04 / Keep the outcome in view
Agree definitions, reporting periods and targets with your team. These sample indicators show where to start.
Illustrative product data. Connect your factory data and agree metric definitions and targets with your team.
Better together
Analytics module
Bring your analytics challenge. We can explore the workflows, data and priorities that matter to your team.