
01
Quality observations
Cost-of-quality views bring the financial impact of scrap and rework into focus.
Review quality issues, repeat defects and corrective actions with their production context.
Designed for Quality engineers and production teams

01 / A familiar problem
The same defect has appeared again during production.
02 / See the workflow
Follow the three stages to see how quality connects information with action.
Is this defect a one-off or a pattern?
Connect defects with scrap, rework, complaints and production context.
03 / Inside Quality
Give your team the visibility and context to move the workflow forward.
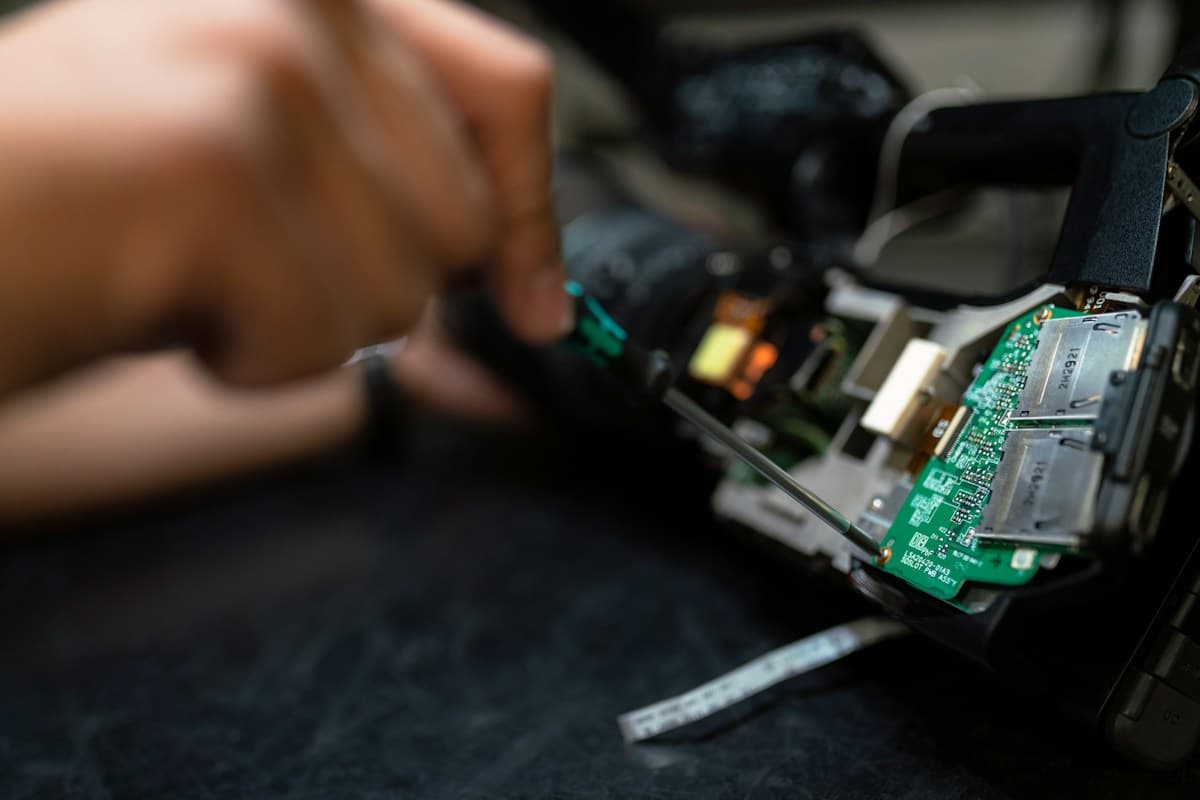
Cost-of-quality views bring the financial impact of scrap and rework into focus.
Pattern analysis helps teams investigate recurring quality issues.
CAPA tracking connects corrective actions with owners and verification.
04 / Keep the outcome in view
Agree definitions, reporting periods and targets with your team. These sample indicators show where to start.
Illustrative product data. Connect your factory data and agree metric definitions and targets with your team.
Better together
Quality module
Bring your quality challenge. We can explore the workflows, data and priorities that matter to your team.